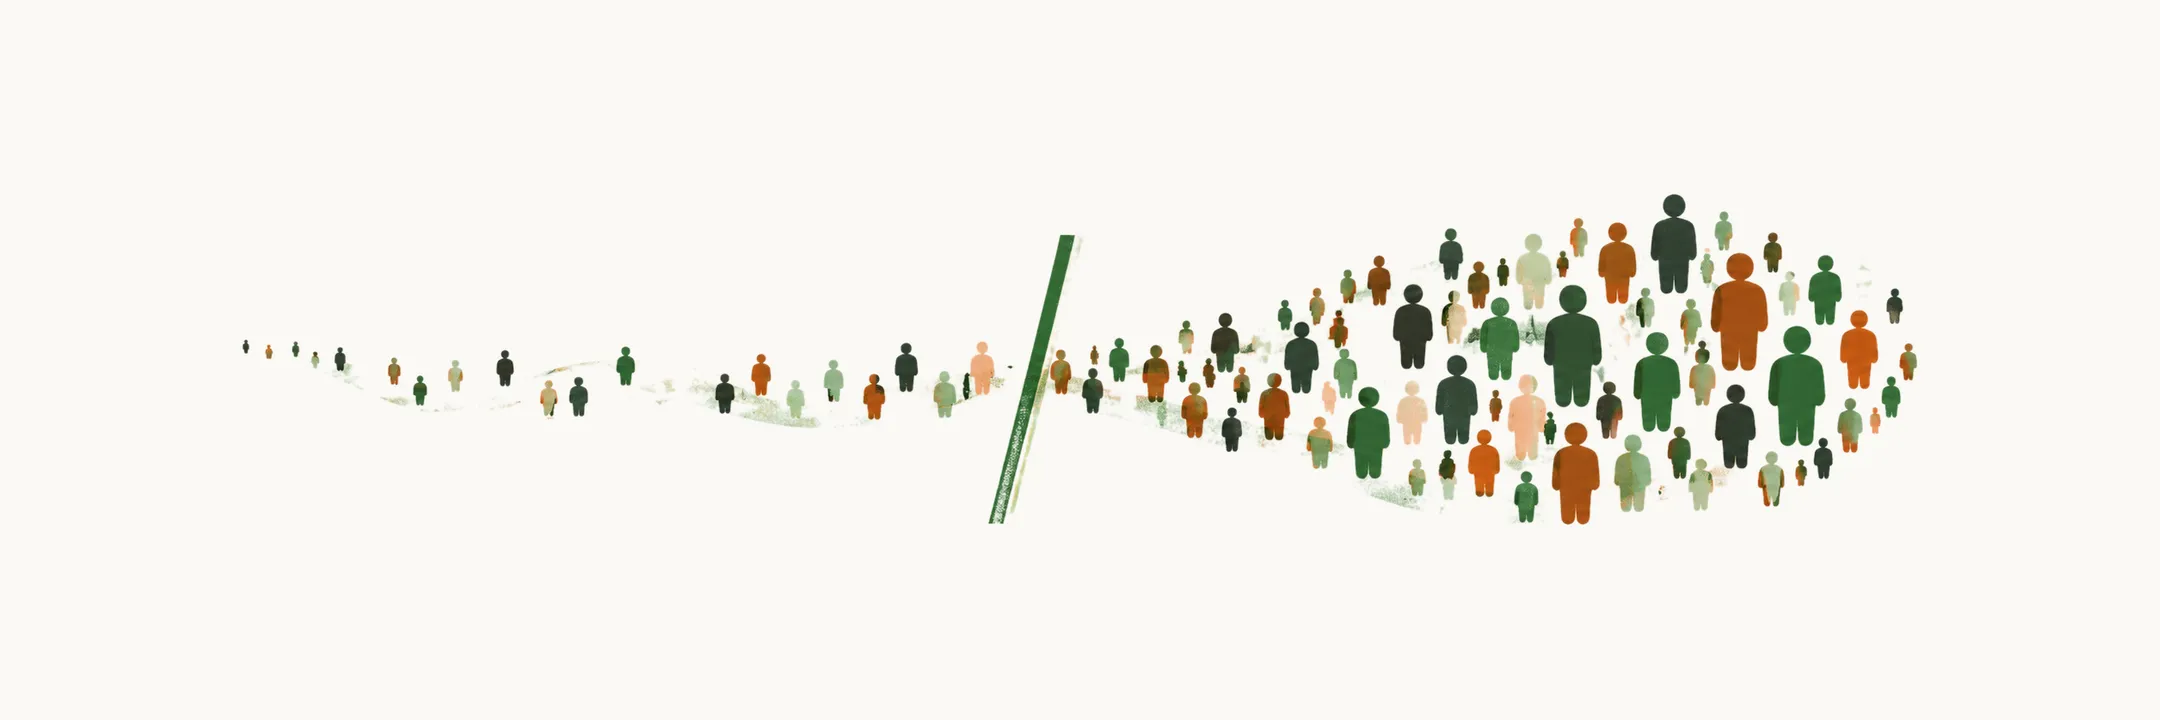
Obesity is common, and it is not spread evenly across a population.
Obesity is too much body fat, and fat cannot be measured directly in a survey of thousands of people. A population is therefore counted with a shortcut: weight set against height, the body mass index (BMI). Each adult falls on one side or the other of a chosen line on that scale, and prevalence is the share of people beyond the line. So every figure below is a count of people past a line, and the line matters as much as the people.
How is obesity counted in a population?
The picture ends on the line, so the first question is how the line is used to count people.
Prevalence is reported against BMI. A survey cannot weigh the fat of each person, so it uses a quick measure that anyone can take. BMI is a measure of body weight in relation to height. Weight alone does not say whether a person is heavy for their size, because a taller person weighs more. BMI divides weight by the square of height, so the two are set against each other.
Two cut-offs are used for BMI-based prevalence, 30 and 40. Obesity is defined as a BMI greater than 30. Severe obesity is defined as a BMI greater than 40.
How common is obesity now?
Once the lines are drawn, the count shows how many adults fall beyond them. In recent US studies, more than 40% of adults have obesity. More than 9% of adults have severe obesity. At the other end, only about 30% of US adults are in the normal BMI range of 18.5 to 24.9.
How fast has it risen?
These counts only mean something over time. Obesity has risen sharply over recent decades. Compared with data from the 1960s, the increase is roughly threefold.
Why does the rise point to the environment?
A threefold rise in a few decades is too fast for genes to have changed, which raises the question of what in the surroundings could be doing it. A proposed explanation is that a society of food abundance and physical inactivity shifts the balance from genes toward the environment in producing obesity.
The threefold increase supports the idea of an obesogenic environment: a modern way of life whose food supply and activity patterns favour weight gain.
Is the rise only in the USA?
The US figures raise the question of whether other countries follow the same direction. They do. In recent years, total prevalence and incidence have been increasing in other countries and regions. For the USA itself, projections point to a total prevalence of 50% obesity in the 2030s.
Does obesity start in childhood?
Children, like adults, show an approximately threefold increase. This matters because pediatric obesity is a risk factor for obesity in adulthood.
Who has obesity?
Prevalence is not the same for everyone. It varies by sex, race, education and income.
Sex and age
Women have an equal or slightly higher prevalence of obesity than men. Central obesity, with fat concentrated in the abdomen and trunk, is less common in women. In recent years the sex distribution of obesity has been becoming more similar. The peak age of occurrence is middle age, between 40 and 60 years.
Race, education and income
There is a significant difference in obesity between races. The highest occurrence is in Black women and in Hispanic men and women.
Prevalence is lower among college graduates than among people with a lower educational level.
The relation to income is not uniform. Prevalence is lower in the highest income group among Hispanic and Asian men only. Among non-Hispanic Black girls there is no income difference in prevalence.
Why do the figures depend on the line?
The differences between groups depend on the line used, which leads to the question of how the line is chosen. Obesity is defined as fat that presents a risk to health, but fat is not what these counts measure. BMI is a stand-in for it, so any figure is only as good as the link between BMI and fat, and the figures depend on how obesity is defined.
BMI cut-offs are also not the same for every population.
But how is body fat itself measured, and how are the BMI lines chosen?