
A febrile infant with no other findings always raises the possibility of a urinary tract infection. A UTI is bacteria inside the urinary tract together with a response from the body. The deciding question is not whether a UTI is possible, because it always is, but how likely it is.
What sets the starting estimate?
The first thing to know is the estimate and what sets it. The pre-test probability is the estimate made before any test has been done. It matters because it determines whether a urine specimen is obtained at all, so the decision to test follows the estimated probabilities.
The estimate varies several-fold with age, sex and circumcision status. The variation is thought to follow the route bacteria take. They probably come from the periurethral area and ascend the urethra. The length of a girl’s urethra and the presence of a boy’s foreskin may change how easily they arrive. The foreskin is a mucosal surface prone to colonisation.
Where do the probability figures come from?
The estimate must be built from figures, and two kinds of study supply them. They answer different questions.
Population cohorts follow children over years and record every first infection. Their figures are counts of new infections over time, so they show how many children are ever affected.
Cross-sectional series test every child in a defined group, such as febrile infants of a given age.
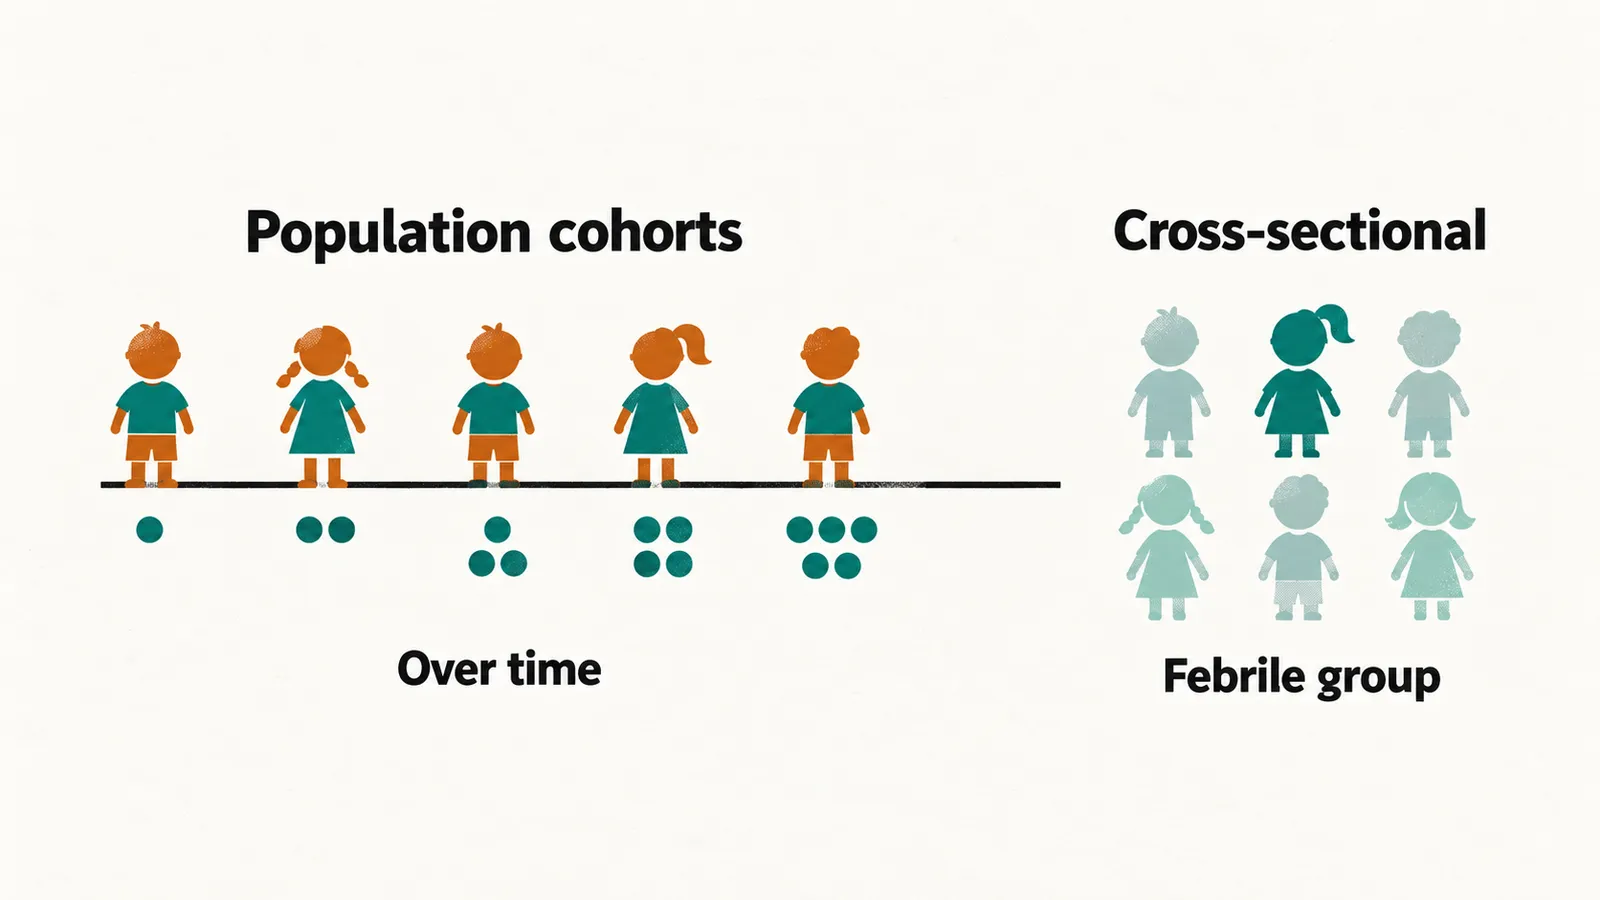
The cohort figure is cumulative. By age 6, an estimated 6.6% of girls and 1.8% of boys have had at least one symptomatic UTI. That figure comes from a population-based study of 299 children under 6 years.
Which figure answers the question in front of you?
The cross-sectional figure is the one that matters when a febrile child is in front of you. It shows how often UTI is the explanation for the illness, which is the question at the moment of the visit.
Take fever without source: fever for which history and examination find no explanation, up to 24 months. The pooled UTI prevalence is 7.0% (95% CI 5.5–8.4). So roughly one febrile infant in fourteen in this age band has UTI as the explanation.
Why are girls at risk across childhood?
The bedside figure is different for girls, and the anatomy explains why. A girl’s urethra is short. That shortens the distance the periurethral and vaginal flora must travel to reach the bladder. This is why girls are at risk across childhood.
The pattern by age is as follows. Annual incidence in girls is 9–14 per 1,000 at risk in each of the six 1-year age intervals. Among febrile girls, prevalence is highest in the first year of life and falls after 12 months.
Why is the uncircumcised infant boy at the top of the list?
Girls and boys differ in anatomy,. The prepuce offers a colonisable mucosal surface for uropathogens. A proposed explanation for why the uncircumcised infant boy sits at the top of the list is this colonisable prepuce.
Uncircumcised boys under 3 months are the highest-risk group, with a prevalence of 20.1% (95% CI 16.8–23.4). Circumcised boys of the same age have a prevalence of 2.4% (95% CI 1.4–3.5).
What happens to boys after the first year?
The question becomes what changes once infancy is over. Boys have most of their infections, including febrile ones, in the first year of life. A proposed explanation is again the foreskin of infant boys as a colonisable surface.
After the first year, the risk falls steeply. Urinary infection of any kind is then rare in boys, at 1–2 per 1,000 at risk.
What moves one child’s probability up or down?
The population figures give the starting point, but the child’s own showing moves it. Between the extremes, what moves an individual child’s probability up or down is what the child shows and can report. That depends heavily on age.
Urinary symptoms alone cannot make the diagnosis of UTI in a child. In children over 2 years with symptoms pointing to the urinary tract, the pooled prevalence is 7.8% (95% CI 6.6–8.9). That is far below the roughly 50% found in adult women with genitourinary symptoms. So urinary symptoms predict UTI far less often in a child than in an adult woman.
Where is the line for testing?
The child’s probability is now set, and the question is where it leads to a test. Probability is what tips the decision. In a survey of pediatricians, most would not culture urine when the estimated UTI probability was under 1%. In that survey, all pediatricians would culture urine when the estimated probability exceeded 5%.
Why is the estimate a starting point, not a verdict?
A number is one input, so the decision needs weighing. Guidance is to test the urine of a child whose symptoms and signs increase the likelihood of UTI. It is not to test routinely when the illness points to another infection. It also says to weigh several features together rather than allowing one symptom to decide.
The arithmetic is a starting point, not a verdict. A well child with a low probability can reasonably be left untested. An unwell febrile infant is sampled and treated regardless of how the numbers fall. The two costs are not the same.
A child who cannot say what hurts still has to be judged, so what does each age show instead?